Researchers identify possible glitch in Antarctic ice measurements | Ars Technica

With all the attention given to every nuance of climate data, areas of research that would have never attracted much public interest sometimes find themselves in the spotlight. So it is with the process of measuring sea ice cover. People pay careful attention because it appears to be a leading indicator of climate change. In the Arctic, where the warming has been most intense, sea ice is retreating rapidly, with record lows having been set every few years over the past decades.
But at the other pole, Antarctic sea ice has been steadily expanding, creating a bit of a conundrum for scientists. They've come up with a variety of explanations for why the two poles might be behaving differently but, in the mean time, people have latched on to the difference to question our understanding of climate change.
Now, a paper has come out questioning whether the difference between the poles is as dramatic as it seemed. The reason for the potential difference? Measuring sea ice is remarkably hard.
You wouldn't think a giant sheet of white stuff against a backdrop of dark ocean would be so difficult to sum up, but using visible wavelengths won't necessarily give you the right number. The consensus in the field is that a specific area of ocean is considered to have sea ice when the coverage reaches 15 percent. If you were simply looking for white stuff, then anything that's white (like frothy waves) could throw you off—as could darker pools of melt water forming on top of the ice. Plus there's the added issue of the poles being in darkness for a lot of the year.
So instead, the field has focused on measuring the amount of microwaves emitted by these regions. Ice emits more microwaves than cold water, which allows the two to be distinguished. Unfortunately, this difference gets less dramatic as the water gets warmer, so ocean currents could potentially throw this off. As a result, the process of searching for ice involves using data from multiple wavelengths and with different polarizations.
Obviously, this analysis isn't run by eyeballing things and punching numbers into a calculator. Instead, software analyzes the raw microwave data coming in from satellites, processing it into less raw data about the location and amount of sea ice.
Currently, there are two different algorithms that are used for this processing, one called "NASA Team" and a second called "Bootstrap." The latter, Bootstrap, is what was used for the analysis that went into the IPCC climate reports.
The authors of the new paper noticed something strange about the two most recent IPCC reports. In the Fourth Assessment Report, released in 2007, Antarctic ice was reported as not undergoing any statistically significant change. By the time of the latest Assessment Report's release, however, the sea ice near the South Pole was found to be expanding rapidly. The authors note that 2007 was significant for a second reason: that was the year the National Snow and Ice Data Center updated the Bootstrap software.
The authors went back and re-analyzed all the data generated with both versions of the Bootstrap program, finding there was a significant difference. Prior to 1991, Bootstrap 1 produced estimates of sea ice extent that were slightly higher than those produced with Bootstrap 2. After that year, however, Bootstrap 1 produces values that are lower. The net result is that, while both algorithms show Antarctic sea ice expanding, the earlier one showed a much more gradual expansion.
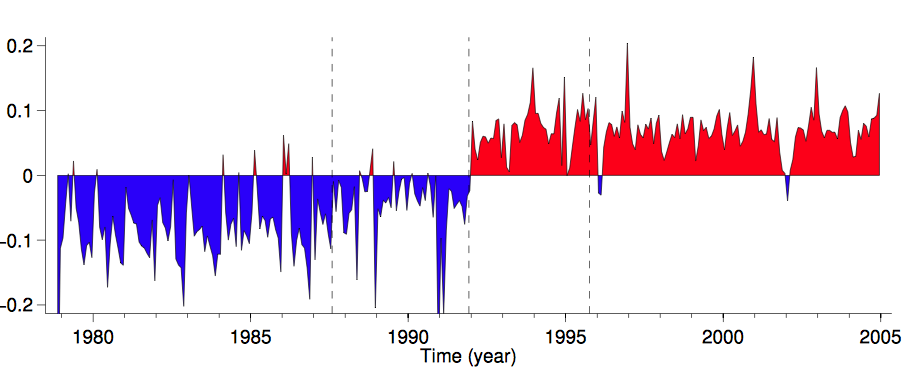 Enlarge/ The difference between the Bootstrap 1 and 2 records, showing a sudden change in 1991.
What happened in 1991? This gets into another reason why measuring ice isn't so simple: the satellite changed. Most of our orbiting hardware has a finite life span, and so it gets replaced on a regular schedule. And the replacements are rarely identical; even the conservatively designed, radiation-hardened hardware moves on. So there are often orderly transitions between instruments, with a period where both are performing identical measurements at roughly the same time, allowing them to be calibrated against each other.
One of these transitions happened in December of 1991. The authors of the new paper conclude that Bootstrap 2 handles compensating for this transition differently, accounting for the change in the ice records before and after this point.
The authors note that, "Our analysis does not definitively identify whether this change introduced an error or removed one." In other words, everything we've been hearing about Antarctic ice could still be true, but it's impossible for them to tell based on the scientific data and computer code that's publicly available. The obvious thing to do is to then talk to the person who maintains the Bootstrap code, something that the authors of the new paper don't appear to have done, even though one of them works at the same institution.
Nature News, however, did. He says that both the original error and the correction were introduced accidentally, which is why they were not documented. However, you can safely assume that scientists will want to have a close look at both versions of the code, if for no other reason than to reassure themselves.
The one thing that they clearly all agree on is that the academic community could clearly use to more thoroughly embrace some of the practices of the software industry, where version control and code documentation is often far more thorough.
While this may all ultimately be much ado about nothing, it's an excellent illustration of the scientific process at work. And it highlights how something that we tend to assume is a simple fact—Antarctic sea ice is increasing—may sometimes be built on top of complicated collection of smaller pieces of data.
The Cryosphere, 2014. DOI: 10.5194/tc-8-1289-2014 (About DOIs).