• Chart: The U.S. Cities With The Most Homeless People | Statista
Homelessness
The U.S. Cities With The Most Homeless People
Over half a million Americans are currently homeless. After a period of progress and decline, the U.S. homeless population has increased slightly by three percent according to a report from the Department of Housing and Urban Development. It now stands at 567,715 with 63 percent of that total living in sheltered accommodation. The national increase is primarily due to a leap in homelessness in California where it grew 16.4 percent between 2018 and 2019.
More than half of all unsheltered homeless people in the U.S. - some 53 percent - are in California. That's nearly nine times as many as the state with the second-highest total of unsheltered homeless which is Florida. Homelessness is primarily an urban issue and more than half of the homeless population is scattered across the country's 50 biggest cities. Nearly a quarter of them live in just two cities - New York and Los Angeles. Despite its considerable homeless population, New York can at least claim that the vast majority of its rough sleepers are given sheltered accommodation with only 4.4 percent estimated to be living on the streets. The same cannot be said of the state of California where 71.7 percent of all homeless people are unsheltered.
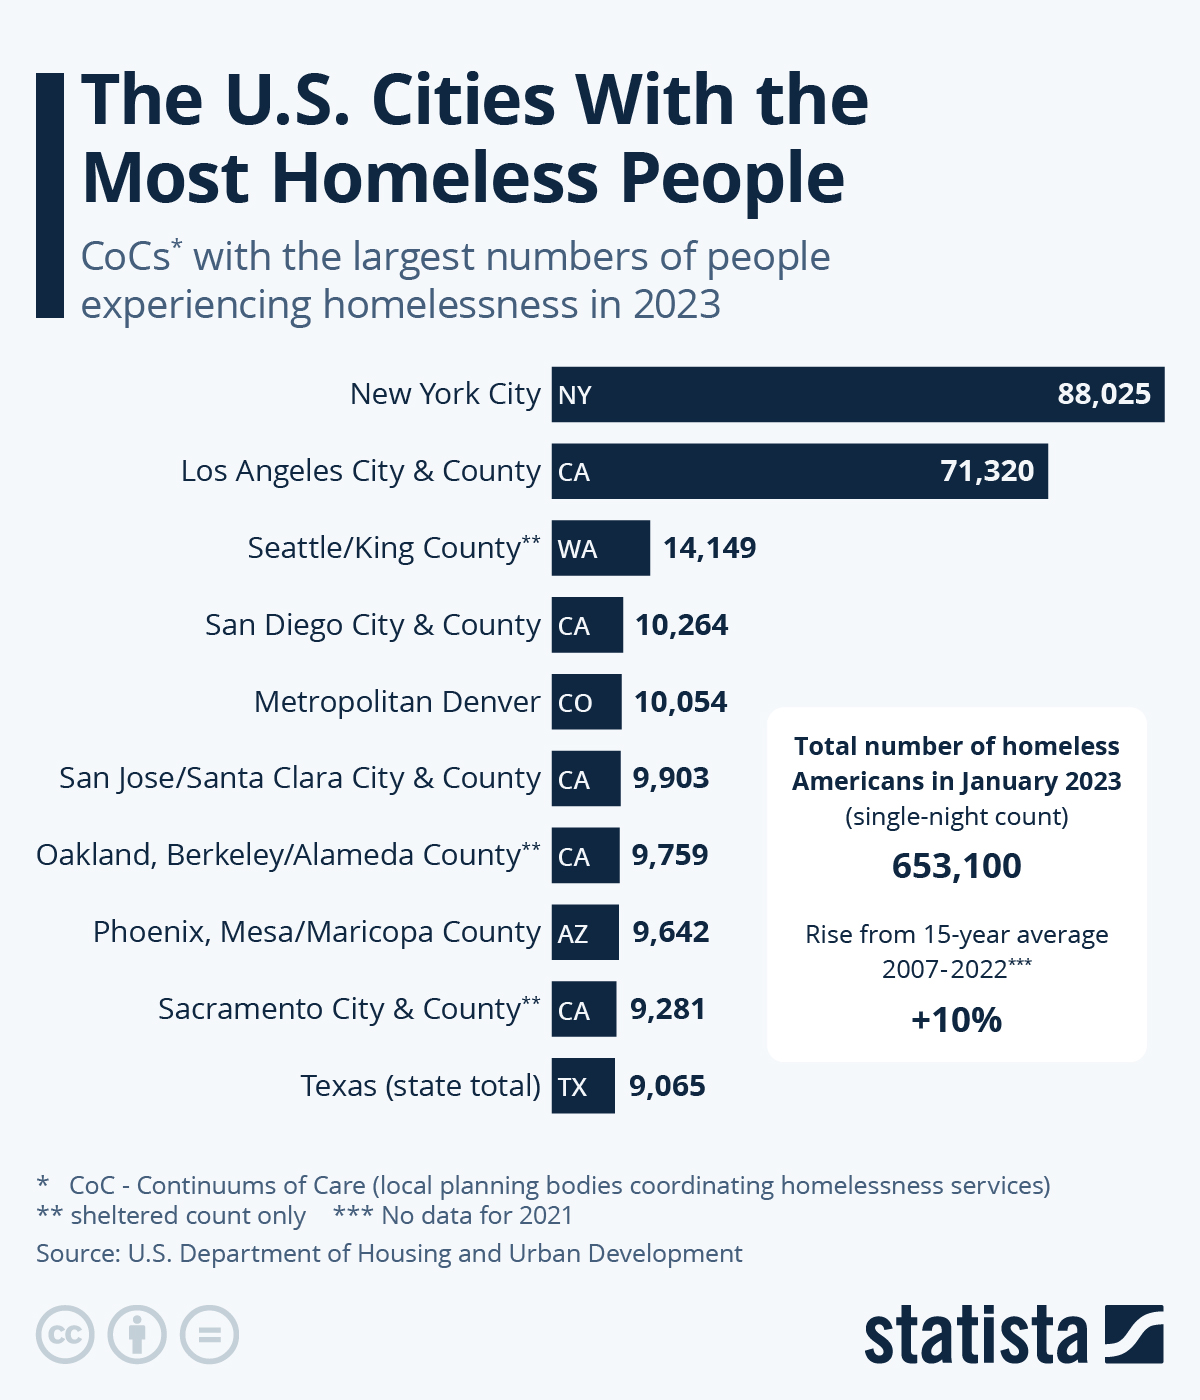
The following infographic shows the top-10 worst cities for homelessness across the U.S. with New York in first place with 78,604. It's important to mention that in this comparison, the data is broken down by CoC - those are Continuums of Care that are local planning bodies coordinating responses to the issue. Los Angeles is in second place with over 56,000 while Seattle/King County comes third with 11,199.
Description
This chart shows CoCs with the largest numbers of people experiencing homelessness in 2019.
URL to be used as reference link:Infographic Newsletter
Statista offers daily infographics about trending topics covering Media and Society.
FAQ
-
Who may use the "Chart of the Day"?
The Statista "Chart of the Day", made available under the Creative Commons License CC BY-ND 3.0, may be used and displayed without charge by all commercial and non-commercial websites. Use is, however, only permitted with proper attribution to Statista. When publishing one of these graphics, please include a backlink to the respective infographic URL.
More Information -
Which topics are covered by the "Chart of the Day"?
The Statista "Chart of the Day" currently focuses on two sectors: "Media and Technology", updated daily and featuring the latest statistics from the media, internet, telecommunications and consumer electronics industries; and "Economy and Society", which current data from the United States and around the world relating to economic and political issues as well as sports and entertainment.
-
Does Statista also create infographics in a customized design?
For individual content and infographics in your Corporate Design, please visit our agency website
www.statista-content-design.de
Any more questions?
Get in touch with us quickly and easily.
We are happy to help!
Statista Content & Information Design
Research, storytelling, infographics & presentation design on any topic in your corporate design.